Declare the signal, not the loop
You write what the position should be, as an expression over the price series. The engine compiles that into a graph, crosses into Rust once, evaluates it over the whole history, and only then walks the bars to fill the orders. No callback per bar, no loop to get wrong, and the same declaration is what a sweep varies and a manifest replays.
That line is the strategy. Everything else is configuration.
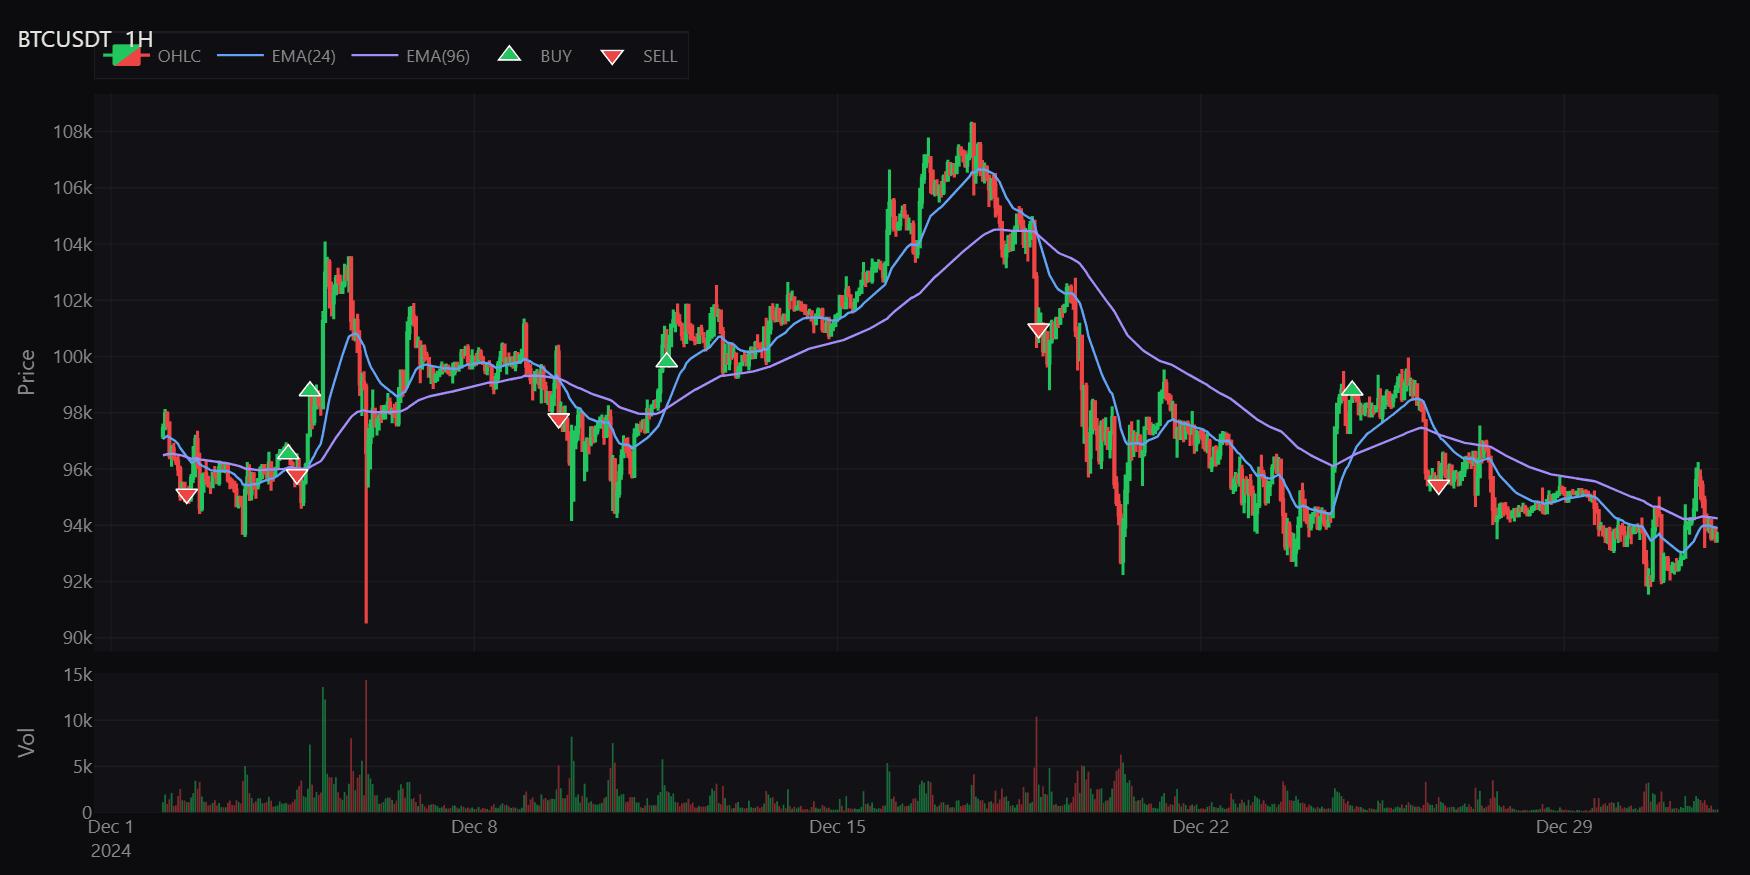
Ten lines, and the bars it traded
The declaration on the left produced the chart on the right: the two averages it declared, and the entries the sizing rule triggered. The indicators are not drawn afterwards for the picture, they are the signals the strategy was defined with.
import manifoldbt as mbt
from manifoldbt.indicators import close, ema

fast, slow = ema(close, 24), ema(close, 96)

strategy = (
    mbt.Strategy.create("ema_cross")
    .signal("fast", fast)          # named, and readable back on the result
    .signal("slow", slow)
    .size(mbt.when(fast > slow, 1.0, mbt.when(fast < slow, -1.0, 0.0)) * 0.25)
)

res = mbt.run(strategy, config, store)   # 6.8 ms over two years of hourly bars
ema(close, 24) does not compute an average. It returns an expression, and comparing two of them returns another one, so fast > slow is a boolean series that has not been evaluated yet.
Nothing runs until mbt.run. Then the whole graph is evaluated column-wise in native code, and the sequential pass that follows is the only part that walks bar by bar, because fills and fees genuinely depend on order.
On two years of hourly bars, the run above takes 6.8 ms end to end. The cost is the data, not the number of operators you wrote, which is the practical reason a signal can be as complicated as your idea requires.
It composes, which is the whole point
A crossover is the easy case. The reason to have a language rather than a list of indicators is the strategy that is not in the list: a ratio against another market, run through a filter, z-scored, gated by the slope of its own mean reversion.
from manifoldbt.expr import col, lit
from manifoldbt.indicators import close, kalman

# A ratio against another market in the universe.
pair = mbt.symbol_ref("binance:ETH-USDT:perp", "close")
ratio = close / (pair + lit(1e-12))

# A stateful filter, then plain arithmetic on its output.
spread = ratio - kalman(ratio, q=1e-4, r=1e-2)

# Windowed methods chain onto anything, including each other.
neg_theta = spread.linreg_slope(28)
spread_z = spread.zscore(28).ewm_mean(8)

signal = mbt.when(
    (neg_theta < lit(0.0)) & ((spread_z > lit(0.5)) | (spread_z < lit(-0.5))),
    (lit(0.0) - spread_z) * lit(0.05),
    lit(0.0),
)

strategy = (
    mbt.Strategy.create("ou_stat_arb")
    .signal("spread_z", spread_z)
    .signal("signal", signal)
    .size(col("signal"))           # a named signal is a column downstream
)
Other markets are expressions too
symbol_ref pulls a column from any symbol in the universe, so spreads, ratios and relative-value signals are ordinary arithmetic rather than a second data pipeline.
Stateful where it has to be
A Kalman filter, a GARCH estimate or a custom scan carries state forward bar by bar inside the engine, and its output is just another expression you can subtract, z-score or compare.
Windows chain onto anything
spread.zscore(28).ewm_mean(8) is a rolling statistic of a rolling statistic of a filtered ratio. Nothing about the second call knows or cares what produced the first.
What is in the box
104 indicator functions, 38 candlestick patterns and 74 methods that hang off any expression. The split matters less than the fact that they interoperate: a method does not care whether its input is a price column, an indicator or something you built out of both.
Trend and averages
sma, ema, dema, tema, wma, hma, kama, macd, supertrend, parabolic_sar
Momentum and oscillators
rsi, roc, momentum, stoch_k, stochastic_k, williams_r, cci, adx, mfi
Volatility and bands
atr, natr, true_range, bollinger_bands, bollinger_width, keltner_channels, garch
Volume and flow
obv, ad_line, vwap, mfi
Statistics and state
kalman, linreg_slope, linreg_value, linreg_r2, rolling_median, scan, zscore, rolling_std
Cross-sectional and cross-asset
symbol_ref, of_symbol, cs_rank, cs_mean, rank
Shape and time
lag, lead, diff, pct_change, cumsum, cumprod, rolling_min, rolling_max, hour, day_of_week, month
Comparison and control
when, crossover, crossunder, cross_above, cross_below, min_val, max_val
Four rules that bite
A declarative language borrows Python’s syntax without borrowing all of its semantics, and the seams show in a small number of places. The engine refuses rather than guesses, and its messages name the rule, which is worth knowing before you meet one.
If you write strategies with an AI agent, the MCP endpoint hands it these rules and the fix for every engine error, which is the difference between code that compiles first try and three rounds of correction.
Parenthesise every comparison
& binds tighter than > in Python, so a > b & c > d parses as a > (b & c) > d and the engine refuses it. Write (a > b) & (c > d).
Price columns are names, not calls
close, high, low, open and volume are expressions already. close is right, close(...) is not.
Qualify a cross-asset reference
symbol_ref("binance:ETH-USDT:perp", "close") needs the provider-qualified name, the symbol has to be in the universe, and the reference belongs inside a signal.
Give the windows their warmup
A 96-period EMA has no value on bar 3. Set warmup_bars past your longest window, or the first trades of the run are decided by a NaN.
# The same declaration, with the periods left open.
fast = ema(close, mbt.param("fast", default=24))
slow = ema(close, mbt.param("slow", default=96))

# Now it is a grid, not a strategy: 250,000 of them in one call.
heat = mbt.run_sweep_2d(strategy, sweep_config, config, store)
The same declaration, with the numbers left open
Replace a period with mbt.param(...) and the strategy stops being one strategy. The sweep substitutes each value into the graph and recompiles it natively, which is how a quarter of a million variants of the same idea run as one call on the research workflow page.
The same property makes the GPU path possible: a graph is something you can compile for another processor, where a Python callback is not. The transpiled subset and what falls back is on the GPU page.
FAQ
Explore the rest of the engine
Every capability is documented the same way: what it does, the code that runs it, and the case where it is the wrong tool.
- The Rust Backtesting Engine
A million bars in 22 ms on one core, a grid swept 25x faster than the same backtests one at a time, and where that advantage stops.
- The Research Workflow
Parameter maps, stability scores, walk-forward folds, Monte Carlo resampling and look-ahead detection, each answering a question one backtest cannot.
- Execution Realism
Slippage, fees, funding, borrow, partial fills and decision-to-fill delay, each an independent model rather than one flat cost assumption.
- Multi-Asset Backtesting
Rank a universe on every bar and trade the cross-section: nine perpetuals in one call, one shared account, portfolio-level exposure and fees.
- GPU Acceleration
Parameter sweeps and Monte Carlo on your own NVIDIA GPU, bit-identical to the CPU path, and the measured grid size below which the CPU still wins.
- Options Backtesting
Contracts that expire, cash-settle at intrinsic value, and post margin under a named model: a real multi-leg spread, held to expiry, on live Deribit data.
Write the idea, not the machinery
The full DSL, all 104 indicators, the 38 patterns and every composition method are in the free version. Nothing about expressing a strategy is behind a licence.