Walk-forward optimization in Python
Optimizing parameters on your whole dataset and reporting the result is the single most common way to lie to yourself in quant research. Walk-forward optimization is the antidote: it only ever scores parameters on data they were not tuned on. There is more than one way to cut those windows, and the choice changes what the answer means. Here is each methodology, what it can and cannot tell you, and how to run it in Python.
What walk-forward optimization is
Walk-forward optimization splits a price history into consecutive folds. On each fold, the parameters are optimized on the in-sample training window, then frozen and measured on the out-of-sample test window that follows it. The windows advance and the procedure repeats. What you read at the end is not one number from one fit, it is the behaviour of a decision procedure: choose parameters from the past, trade them into the future, repeat.
That distinction is the whole point. A parameter sweep describes the shape of the parameter space over a fixed period: where the good region is, how wide it is, how sharply it falls off. A walk-forward tests whether picking from that shape actually works on data you have not seen.
Overfitting: the problem walk-forward optimization solves
Overfitting, or curve fitting, is tuning a strategy's parameters until they describe the noise of one price history rather than anything repeatable. The trap is structural, not carelessness: an optimizer returns the maximum of a grid, and that maximum is the combination the sample's noise flattered most, so the reported number is biased upward by construction. Search hard enough over a fixed history and you will always find something brilliant on it. That is not evidence of an edge, it is evidence that you searched.
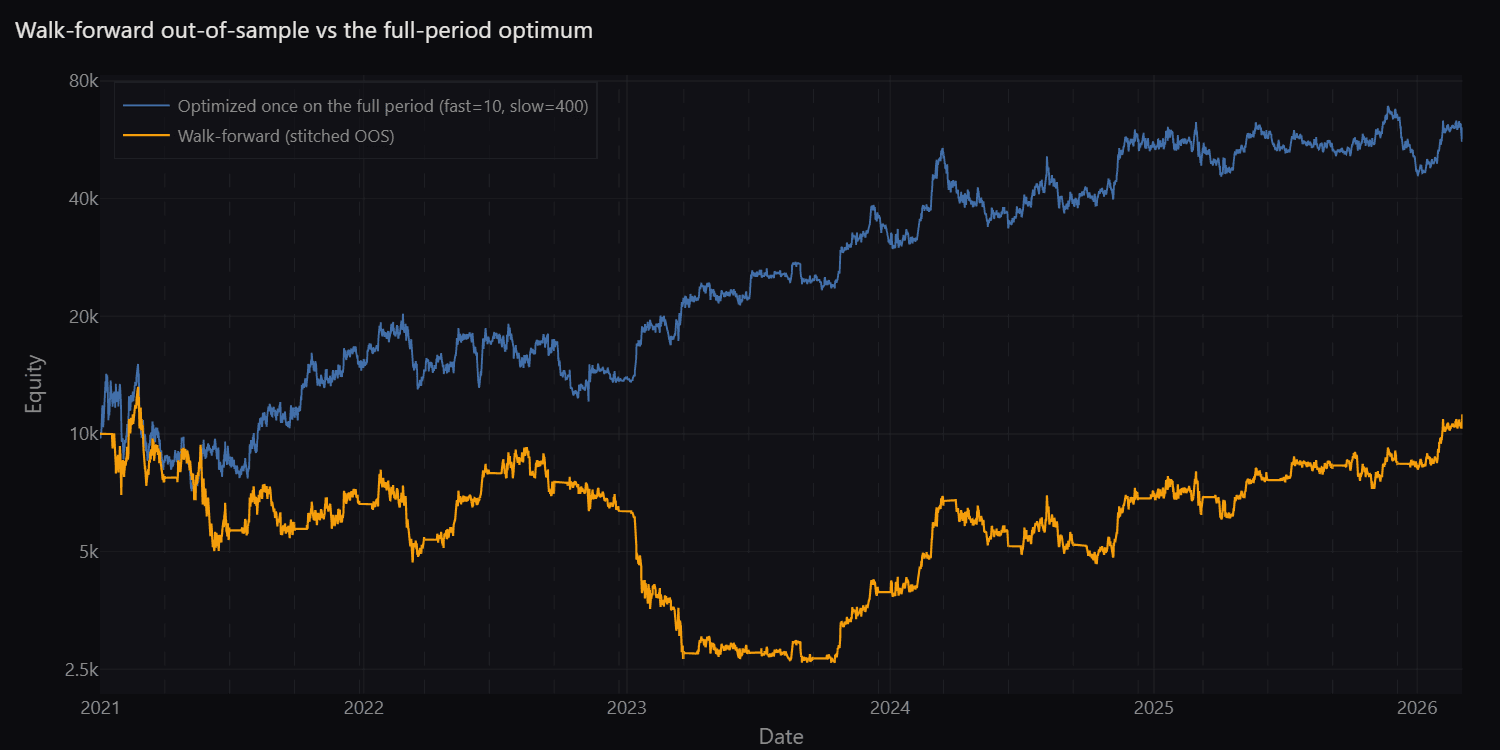
The gap is wider than people expect. In the run below, sweeping the whole history picks fast=10 and slow=400, which turns 10,000 into roughly 60,000. The same strategy with its parameters rechosen every quarter, on data ending before each test window, returns 10.7% over five years and spends 2023 down 80%. Nothing changed except when the parameters were allowed to be chosen.
The four walk-forward methodologies
Every walk-forward variant in common use is the same protocol with a different cut. Two questions decide the geometry: does the training window grow from the first bar or slide at a fixed length, and do the test windows tile the calendar, leave gaps, or overlap each other. Four named answers cover the field.
| Geometry | Training window | Test windows | Fold count |
|---|---|---|---|
| anchoredexpanding, recursive | Starts at the first bar, grows every fold | Tile the tail end to end | Chosen |
| blockednon-overlapping blocks | A fresh fixed block per fold, nothing shared | Separated by gaps, they do not tile | Chosen |
| pardorolling, sliding window | Fixed length W, slides forward | Tile end to end | Derived from W and L |
| customoverlapping, free-form | Anchored or rolling, your choice | Length L and step S both free | Derived from W, L and S |
- anchored (expanding, recursive)
- Long histories where you want every past bar to keep counting. The training sample grows fold after fold, so late folds are the best informed.
- blocked (non-overlapping blocks)
- Robustness across regimes, not a track record. Zero data is shared between folds, which makes each one a clean independent read, but the gaps mean the segments never chain into one curve.
- pardo (rolling, sliding window)
- The canonical walk-forward. Constant training size, old regimes fall out of the window, and the out-of-sample segments stitch into one tradable curve.
- custom (overlapping, free-form)
- More folds out of a short history, at the cost of independence between them. The only geometry that can express overlapping test windows.
Which geometry to choose
If you want a number you could have traded, use pardo or anchored. Both lay their test windows end to end, so the out-of-sample segments chain into one continuous equity curve over unseen data. Between the two: anchored gives each fold more history and a steadily larger training sample, rolling keeps the training sample constant and lets old regimes fall out of the window. If your market changed character somewhere in the sample, rolling will show it and anchored will dilute it.
Use blocked when the question is robustness rather than performance. Its disjoint segments share no bar at all, which makes each fold a clean independent read on a different stretch of market, but its test windows do not tile the calendar. Stitching them would produce a curve with holes in it, so read blocked results fold by fold and never as a track record.
Reach for custom when the history is too short to give you enough folds any other way. Setting the step shorter than the test window overlaps the windows and buys more folds, but the extra folds are not free: the same dates get tested more than once, so the folds are correlated and the apparent sample size is not the real one. That is worth being explicit about, which is why Manifold-BT returns effective_folds alongside n_folds: the union of the test windows divided by the window length. Sixteen overlapping folds can carry the statistical weight of four.
Reading the result
Three things are worth reading, in this order. The figures below come from one real run, the one whose code is in the next section: a long/short EMA crossover on BTCUSDT hourly bars, Pardo geometry, a two-year training window sliding in ninety-day steps over 2019 to 2026, which works out to 21 folds of out-of-sample.
The gap. In-sample against out-of-sample, fold by fold. Some decay is normal; a collapse is the strategy telling you it was fitted, not tuned. The formal version of this is Pardo's walk-forward efficiency, the out-of-sample CAGR divided by the in-sample CAGR, averaged over the folds where the in-sample base is positive. Near 1 means the strategy kept what it was fitted to. Well under 0.5 means most of the in-sample result was curve fit. The run below scores 0.35.
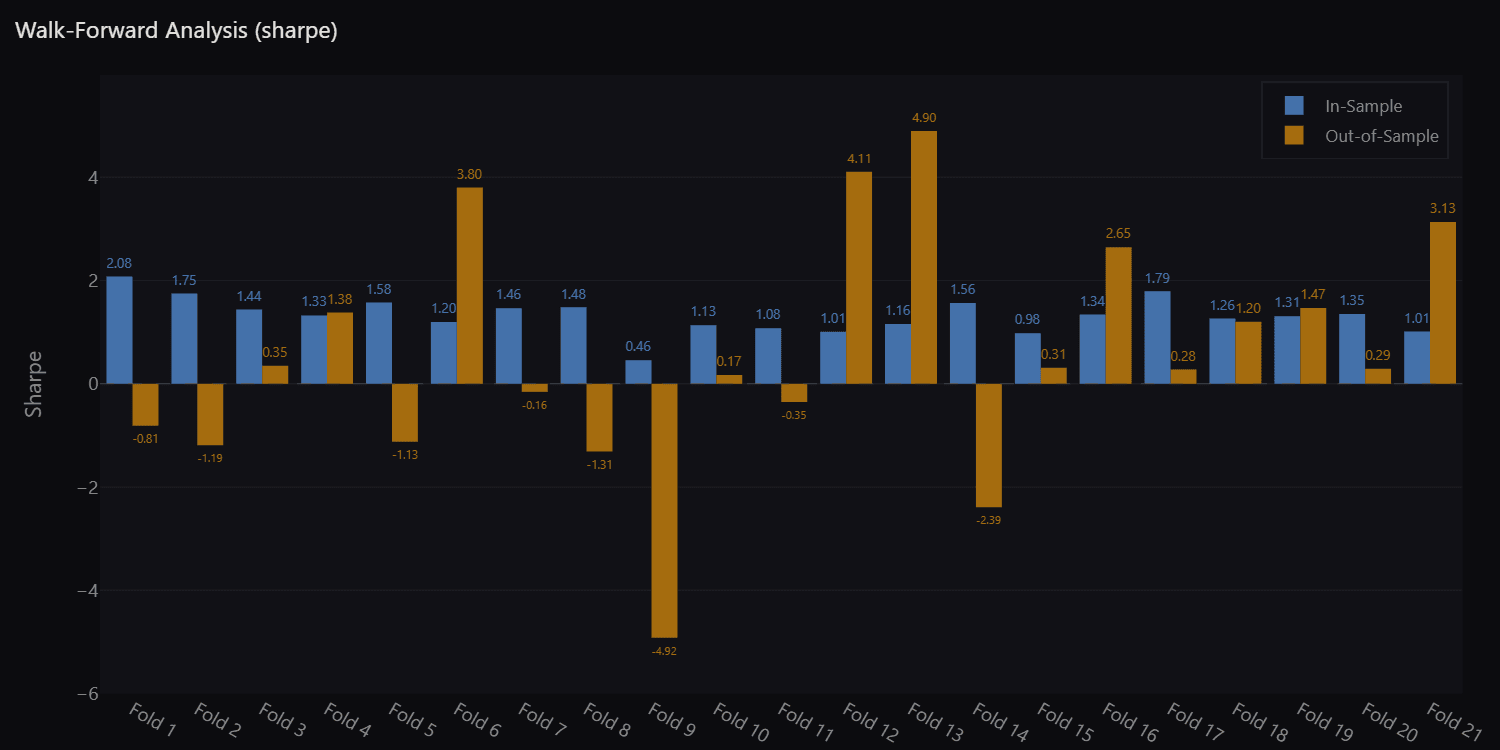
The parameter drift. What the optimizer actually chose, fold by fold, from best_params_per_fold. A stable optimum that moves gradually is a strategy tracking a slow-moving market. Parameters that jump the whole width of the grid between consecutive folds are not tracking anything, they are chasing noise, and the out-of-sample column is the bill. In the run above the fast period opens 160, 10, 40, 160: the top of the grid, the bottom, the middle, the top again, in four consecutive quarters. It settles after that, sitting on 160 for six folds and on 10 for five more, which is a real regime rather than noise. The exception is telling: fold 9 is the only one where the slow period collapses from 400 to 50, and fold 9 is also the worst out-of-sample fold on the chart at -4.92.
The stitched curve. The out-of-sample segments chained end to end, against the same strategy optimized once over the full period. This is the picture that usually ends the argument.
Walk-forward in Manifold-BT
Wrap the parameters you want tuned in mbt.param() and call run_walk_forward() with a geometry and a parameter grid. Every fold's in-sample optimization is a parameter sweep, and the Rust core runs those in parallel. The run below is 21 folds over a 20-combination grid on seven years of hourly BTCUSDT bars, which is 420 in-sample backtests plus the out-of-sample evaluations: it returns in 0.39 seconds.
import manifoldbt as mbt
from manifoldbt.indicators import close, ema
from manifoldbt.helpers import time_range, Slippage, Interval

# Wrap the periods in mbt.param so each fold can re-optimize them.
# A hardcoded int compiles every combo to the same strategy, and the
# optimization becomes a silent no-op.
fast_p = mbt.param("fast", default=40)
slow_p = mbt.param("slow", default=200)
fast, slow = ema(close, fast_p), ema(close, slow_p)

strategy = (
    mbt.Strategy.create("wf_ema")
    .signal("fast", fast)
    .signal("slow", slow)
    .size(mbt.when(fast > slow, 1.0, -1.0))   # long above, short below
)

start, end = time_range("2019-01-01", "2026-05-31")
config = mbt.BacktestConfig(
    universe={"binance": ["BTCUSDT"]},
    time_range_start=start,
    time_range_end=end,
    bar_interval=Interval.hours(1),
    initial_capital=10_000,
    execution=mbt.ExecutionConfig(allow_short=True, max_position_pct=1.0),
    fees=mbt.FeeConfig.binance_perps(),
    slippage=Slippage.fixed_bps(2),
    warmup_bars=400,
)
store = mbt.ingest(provider="binance", symbol="BTCUSDT", symbol_id=1,
                   interval="1h", start="2019-01-01T00:00:00Z",
                   end="2026-05-31T00:00:00Z")

# Pardo's rolling walk-forward: a two-year training window that slides,
# ninety-day tests laid end to end. The fold count is derived from those
# two lengths, not chosen: this history gives 21 folds, and the 88-day
# tail that cannot fill a whole test window is left uncovered.
wf = mbt.run_walk_forward(
    strategy,
    {
        "geometry": "pardo",
        "train": {"length": Interval.days(730)},
        "test": {"length": Interval.days(90)},
        "optimize_metric": "sharpe",
        "param_grid": {
            "fast": [10, 20, 40, 80, 160],
            "slow": [50, 100, 200, 400],
        },
    },
    config=config,
    store=store,
)

wf["n_folds"]                  # 21, derived from the window lengths
wf["effective_folds"]          # 21.0: the tests tile, so none is redundant
wf["walk_forward_efficiency"]  # 0.35: a third of the in-sample survives
wf["best_params_per_fold"]     # how the optimum drifts over time

for fold in wf["folds"]:
    print(fold["fold_index"], fold["is_metrics"]["sharpe"],
          fold["oos_metrics"]["sharpe"], fold["wfe"])
The same call takes any of the four geometries. Anchored and blocked are parameterized by a fold count and a training ratio; Pardo and custom are parameterized by window lengths, and the fold count falls out of them:
# Anchored: training starts at the first bar and grows.
{"geometry": "anchored", "n_splits": 5, "train_ratio": 0.7, ...}

# Blocked: disjoint segments, no bar shared between folds.
{"geometry": "blocked", "n_splits": 5, "train_ratio": 0.7, ...}

# Pardo: a fixed training window slides, tests tile end to end.
{"geometry": "pardo",
 "train": {"length": Interval.days(365)},
 "test": {"length": Interval.days(90)}, ...}

# Custom: both axes free. Anchored training here, and a step shorter
# than the test window, so the test windows overlap.
{"geometry": "custom",
 "train": {"mode": "anchored", "min_length": Interval.days(365)},
 "test": {"length": Interval.days(180), "step": Interval.days(90)}, ...}

# Every duration also accepts a *_bars twin, counted in signal bars:
{"train": {"length_bars": 2190}, "test": {"length_bars": 540}}
The four explicit geometries ship in 0.18. Walk-forward optimization is a Pro feature. Single backtests and parameter sweeps up to 256 combinations are available in the free version; Pro removes the sweep cap.
Four ways a walk-forward quietly stops being honest
Cold indicators at the fold boundary. If the out-of-sample run starts empty at the first test bar, an EMA(200) spends the start of every fold filling up, and the out-of-sample metric mostly measures that warm-up rather than the strategy. Manifold-BT simulates each fold from the start of its own training window with trading suppressed until the test window opens, so the indicators are hot at the boundary.
Hardcoded parameters. If a period is written as an integer instead of mbt.param(), every combination in the grid compiles to the same strategy and the optimization becomes a silent no-op that reports a perfectly stable optimum.
Counting overlapping folds as independent. Overlapping test windows inflate the fold count without adding evidence. Read effective_folds, not n_folds.
Rerunning until it passes. Changing the geometry, the metric or the grid and rerunning until the out-of-sample number looks acceptable overfits the walk-forward itself. The first honest run is the answer.
Frequently asked questions
What is walk-forward optimization?
Walk-forward optimization tunes a strategy's parameters on an in-sample window, then tests those parameters on the next, unseen out-of-sample window, and repeats across the data. The combined out-of-sample results estimate real-world performance.
Why is walk-forward better than a single backtest?
A single optimized backtest reports in-sample performance, which is inflated by overfitting. Walk-forward only ever scores parameters on data they were not tuned on, so it exposes strategies that only worked in hindsight.
What is overfitting in a trading strategy backtest?
Overfitting, also called curve fitting, is tuning a strategy's parameters until they describe the noise of one particular price history instead of repeatable market behaviour. It is structural rather than careless: an optimizer returns the maximum of a grid, and that maximum is the combination whose edge was most flattered by that sample's noise, so the reported figure is biased upward by construction and the bias grows with every parameter, grid value and discarded variant. A single optimized backtest cannot detect it, because the number it reports is the same number that would expose it. Separating parameter choice from parameter scoring, which is what walk-forward optimization does, is the fix.
What are the different walk-forward methodologies?
There are four in common use, and they differ only in how the training and test windows are cut. Anchored, also called expanding, keeps the training start fixed at the first bar and grows the window. Rolling, the canonical form described by Robert Pardo, slides a fixed-length training window forward with test windows laid end to end. Blocked cuts the history into disjoint segments with no bar shared between folds, which leaves gaps between test windows. Custom leaves both axes free, including overlapping test windows where the step is shorter than the window.
What is the difference between anchored and rolling walk-forward?
Anchored keeps the training window's start fixed at the first bar and grows it, so every fold uses all history up to that point. Rolling slides a fixed-length window forward, so old data drops out. Rolling adapts faster to regime change and keeps the training sample size constant across folds; anchored uses more history per fold and gets steadily more data-rich as it advances.
What is walk-forward efficiency (WFE)?
Walk-forward efficiency is Robert Pardo's ratio of out-of-sample return to in-sample return, computed per fold as the out-of-sample CAGR divided by the in-sample CAGR and then averaged. A WFE near 1 means the strategy kept out of sample what it was fitted to; a WFE well below 0.5 means most of the in-sample result was curve fit. It is undefined when the in-sample base is zero or negative, because a ratio on a negative base carries no meaning.
How many folds should a walk-forward use?
In anchored and blocked geometries you choose the fold count directly. In rolling and custom geometries the fold count is derived from the window lengths and the step, never chosen: given a training window W, a test window L and a step S, the history determines how many complete test windows fit. What matters statistically is the number of independent folds. Overlapping test windows inflate the fold count without adding independent evidence, so sixteen overlapping folds can be worth only four.
Does walk-forward optimization eliminate overfitting?
No. It measures parameters only on unseen data, which removes the in-sample inflation of a single optimized backtest, but the walk-forward protocol itself can be overfitted if you rerun it with different geometries, metrics and grids until one looks good. Treat the first honest walk-forward as the answer, not as the first of many attempts.
Keep reading
- The research workflow →
- GPU Acceleration →
- Realistic backtest execution →
- Manifold-BT vs RaptorBT →
- Full benchmark results →
- Best Python backtesting libraries, compared →
- How to backtest a trading strategy →
- What is backtesting? →
- Algorithmic trading in Python →
- Backtest a trading strategy with Claude Code →
Run your first backtest
Install Manifold-BT and reproduce the backtest above in seconds. The Rust core runs years of bars sub-second so you can sweep parameters instead of waiting.